
Bryce Harper or J.D. Martinez Cubed?
A look into how to best spend $330 Million on Baseball Star power

Okay, so I have never done this before, but here we go.
Imagine this. You are a major league baseball General Manager, and you have an Owner who has given you $330 million. With that money, you can sign either 1 Bryce Harper (former NL MVP, 4 time All Star, 1 time Silver Slugger, 2012 Rookie of the Year, 2018 HR Derby Winner) in the 2018 offseason to a 13 year, $330 million deal, or 3 J.D. Martinez’s (1 time All Star, 1 time Silver Slugger) in the 2017 offseason all to 5 year, $110 million deals. Which is the better choice?
Obviously, Bryce is a household name and has more awards on his mantlepiece and can play defense better than J.D. Martinez can. But the side by side comparison paints a different picture as to who the better player is.
Let us start by comparing Martinez and Harper’s stats from 2014 (the year J.D. finally came in to his own) and 2019 (the most recent season played in the MLB)
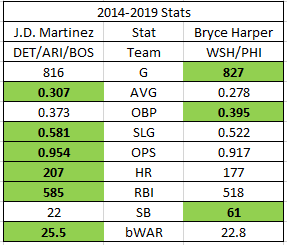
So, over the last 6 years J.D. has lead Harper in Average and OPS by about 30 points, SLG by 60 points, hit 30 more HR, got about 60 more RBI, and about 3 more WAR. Meanwhile, Harper played in 11 more games and had 20 points better in OBP and about 40 more SB. Unless you really like walks and steals, it seems clear J.D. has outperformed Harper over this stretch, especially on the offensive side of the ball.
Let’s also take a look at stats in contract year for each player (J.D. in 2017 with the Tigers and Diamondbacks, and Bryce in 2018 with the Nationals)
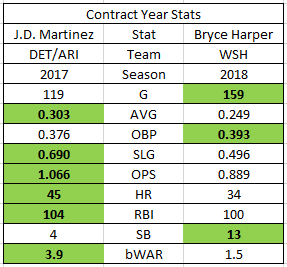
Okay, similar picture here. J.D. and Harper lead in the same categories they did over the 6-year period, so that is something. It looks like the margin is a lot bigger here though, J.D. leading Harper 50 points in average and about *200* points in SLG and OPS. J.D. also hit 11 more HR and 4 more RBI in 40 less games. WAR paints the same picture, with J.D. worth 2.4 more wins.
Immediately I was curious as to why J.D. was so much better in his contract year vs Bryce in his contract year, compared to their 6 season averages. I figured this was likely because Harper had a monster campaign in 2015 where he won the MVP. Thus, why not compare these player’s best and worst career numbers in these categories? Note that for J.D. I excluded his 2011-2013 marks in Houston. While this didn’t come in to play for career highs, J.D. would easily have the lowest lows if those years were counted, but he had limited playing time and that was before he changed his swing, and therefore is not representative of the player he has been since 2014.
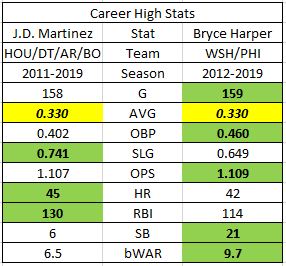
Okay, so Harper seems to, in general, have higher highs, but in general things seem close across the board. Harper again has comfy OBP lead, and J.D. a comfy lead in SLG. Harper does have a nice WAR lead here, likely because he had stellar offensive and defensive numbers back in his MVP 2015 season (while J.D. has been average at best on defense in his career).
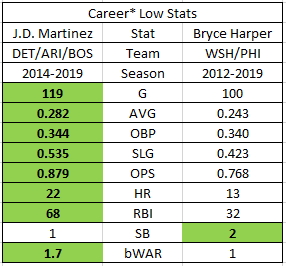
Again note these comparisons are a “cherry pick” of sorts as they exclude the first three years of J.D.’s career, but like mentioned he became a new and improved hitter in 2014 with that swing change and that is the guy he is now. Based on these numbers, J.D. has a much higher floor than Harper. J.D. even managed to squeak past Bryce in the OBP in this comparison, by just 4 points.
Okay, well, enough comparison of these players over their careers and leading up to the contracts. Let us dig into how 3 J.D.’s (2018-2022) compare to 1 Bryce Harper (2019-2031). How do we do this, as it is only 2020, and this year isn’t even going to be played? Well, good question! First, we will look at how J.D. has fared his first two years in his deal, and the Harper in the first year of his, and then use OOTP Baseball to simulate the possibilities!
First, Martinez. He has averaged 148 games a year for the Sox, mostly playing DH but occasionally getting reps in Left or Right. Both years he has been an All Star and received MVP votes (4th place 2018, 21st place 2019). He also won TWO Silver Sluggers in 2018, one for DH and one for OF. He has hit 79 HR, driven in 235, batted .317 and has a .985 OPS. Multiply those numbers by 3 and the J.D. army has already racked up 237 HR and 705 RBI in two seasons with the Sox, with a combined 6 AS appearances, 6 Silver Sluggers, and 3 top 5 MVP finishes. Oh, and I nearly forgot 9.9 WAR over the two-year span each, for a total of 29.7 WAR between the 3. That is some serious production.
Bryce has only spent one season in Philly, and of course he will not get that x3 multiplier as we are only looking at the one of him. He hit 35 dingers in 157 games, batting .260 with 114 RBI. His OPS was .882, and he played in right field. While that was good for 4.3 WAR, Harper did not pick up any hardware in the first year of his mega deal, missing the All Star game for the first time since 2014 and receiving no votes in the MVP race.
Now we are going to look at 4 different data points to figure out who wins this deal using OOTP21, 3 for JD and 1 for Harper:
1. JD’s stats 2018/19 *3, and then 3 JD’s stats on the Red Sox 2020-2022; all summed
2. 3 JD’s on the Red Sox simmed from 2018 until 2022 (redoing 2018 and 19 with 3 JD’s)
3. 3 JD’s on the Diamondbacks simmed from 2018 until 2022 (to see defense in NL)
4. Harper stats 2019 and then simulated stats 2020-2031; all summed
I decided to look at JD’s in the NL because obviously in the AL you can have a JD in Left, a JD in Right, and a JD at DH; but in the NL without the DH you would likely need to use the 3rd JD at 1B (unless you wanted him in CF to give one of the worst OF defenses of all time). This was being tested to see if maybe Harper would be the right choice for a NL team, but not an AL team.
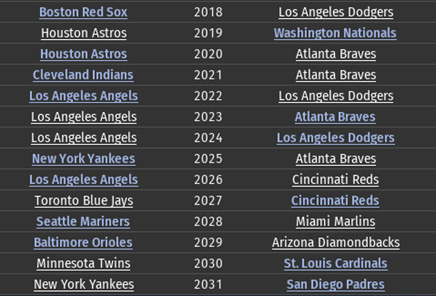
Before we dive into the stats, I’ll start with describing situations #1 and #4, simulated in the same universe. The Phillies only made the postseason once with Harper, in 2023 as the 2nd wild card. Over the 12 simulated years (heck, even including the real 2019 season) the Phillies had Harper they had a winning record twice, in 2023 (85-77, 3rd in NL East, 2nd WC) and 2024 (82-20, 3rd NL East). The highest they finished position wise in the NL East was 2nd, in 2025 (79-83). The Red Sox did not make it back to the post season the three years they had 3 copies of Martinez, finishing 4th, 5th, and 5th in the AL East.
For those curious who won the World Series each year, the winners are below in blue (the white team was the runner up). Note for the purpose of the simulation, injuries were disabled and the league did not evolve at all beyond the rule changes set before the 2020 season.
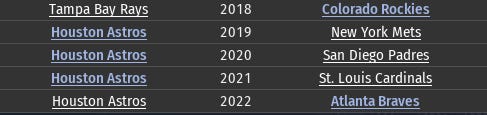
Situations 2 and 3 were also simmed in the same universe, and I won’t get into much detail, but I started with 3 J.D.’s on the Red Sox and 3 J.D.’s on the D-backs. 2 of the J.D.’s on the Sox immediately got shipped to the Mariners and 1 of the D-backs J.D.’s was shipped to the White Sox in 2021 for the last two years of his deal. The Red Sox made the post season every year (won division in 2018 and wild card 2019-2022); the Mariners made it once (2018); the Diamondbacks twice (2018-19) both as wild cards; and the White Sox won their division both years they had a J.D. (2021-22), after getting a wild card the previous two years.
Below, again, for those curious is the world series results in this simulation (which did resimulate the 2018 and 2019 series). Clearly, the Astros were not caught in the universe.
Anyways, on to the results… drumroll please…

Any guess who is who?
A. JD’s real stats 2018/19 *3, and then 3 JD’s stats on the Red Sox 2020-2022; all summed
B. 3 JD’s on the Red Sox simmed from 2018 until 2022 (redoing 2018 and 19 with 3 JD’s)
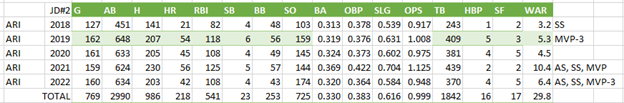
C. 3 JD’s on the Diamondbacks simmed from 2018 until 2022 (to see defense in NL)
D. Harper stats 2019 and then simulated stats 2020-2031; all summed
I won’t dive into too much detail on the individual season stats, but I put a nice NL version of J.D. and Harper’s stats at the end.
So, just as we saw earlier, unless you are a fan of walks and steals it looks like all three versions of the J.D. simulation did the best. Surprisingly, the NL iteration of J.D.’s seems far and away the best, with 2 MVP trophies and the highest games played/HRs/slash line of them all.
Early releases of this project had other curious what that stats looked like for Harper over the period J.D. was signed for (his ages 30 to 34 seasons), so I will show a table of what turns out to be each J.D.’s stats over the course of the 5 year contract, and how Harper did ages 30-34.

Now we get to look at some flaws in doing this. First, you will notice none of the fictional J.D.’s ever won a ring. The burden of on average $66 million a year for 5 years is a steep one and is hard to build a team around. The fact I basically just plopped these J.D.’s down resulted in quite a few of them being dealt for that very reason, as the GM’s did not get a chance to build the team around knowing they were going to have to pay for and have 3 J.D.’s (after all, that Sox OF already had Benintendi, JBJ, and Betts in 2018; and A.J. Pollock was still on the ARI squad at the time as well). This those deals being made it is hard to gauge just how valuable 3 JD’s on a team could be, as the defensive stats (which in this case I limited just to being worked into the WAR) would have taken a dip. With that said, the NL Martinez’s who played LF, CF, and RF every day together 2018-2020 before the one was dealt had some of the highest production of all.
There is also three Martinez data points to Harper’s one. I should probably have run a second Harper simulation, maybe 2019-2031 all in OOTP, but it just takes so long to simulate 13 years I decided against doing so.
Also, while both Martinez and Harper are household names, Harper has more hype and brings a bit more value to the table in that regard. Ticket sales, jersey sales, and hype cannot be undervalued, although that also probably should not be the deciding factor in who you sign.
The other place, other than sales, we can look off the stat sheet is clubhouse presence. In general, after doing some reading Harper seems to have a mixed reputation, while Martinez seems to be a lot more highly regarded. In particular, I found this article which highlights how Martinez helps out this teammates off the field and is a leader in the clubhouse.
Anyways, after three days of simulations and number crunching, I have concluded 3 J.D. Martinez’s, signed to 5 year/$110M deals is a better choice than signing 1 Bryce Harper to a 13 year/$330M deal. Overall better offensive production, and likely enough to offset any loss on the defensive side of the ball, even in the NL. With all that said, both players are tremendous talents and we are lucky to get to see them play in our lifetime.
Now those season by season stats, as promised:
The NL beast of a JD:
Bryce Harper:

Would love to see your thoughts and what you would choose!
Credit to Out of The Park Baseball and Baseball Reference for all of the fun data stuff
What happened in 2023 to cause Harper to hit 56 home runs? #JuiceBall2.0